


06/11/2026

Share:
06/11/2026
Share:


Written by Antreas Themistokleous, Exness Trading Content Specialist
When I started looking at how markets behave around US midterms, one statistic caught my attention: the S&P 500 has risen in the 12 months after the election, regardless of which party won.
That’s a striking record, but it’s not a forecast. What I find most interesting is separating the historical tendency from the economic and monetary conditions surrounding it; then I ask whether today’s backdrop could keep the pattern alive. I begin with the bullish history, then turn to the harder question: does 2026 have conditions to repeat it?
What does history actually tell us?
Looking at the S&P 500 from 1950 to 2022, the index recorded positive price returns in the 12 months following all 19 midterm elections. Across these post-election periods, the S&P 500 gained an average of 16%, although individual outcomes varied considerably. This is an interesting pattern, but the average alone doesn’t tell me whether the election itself explains the performance.
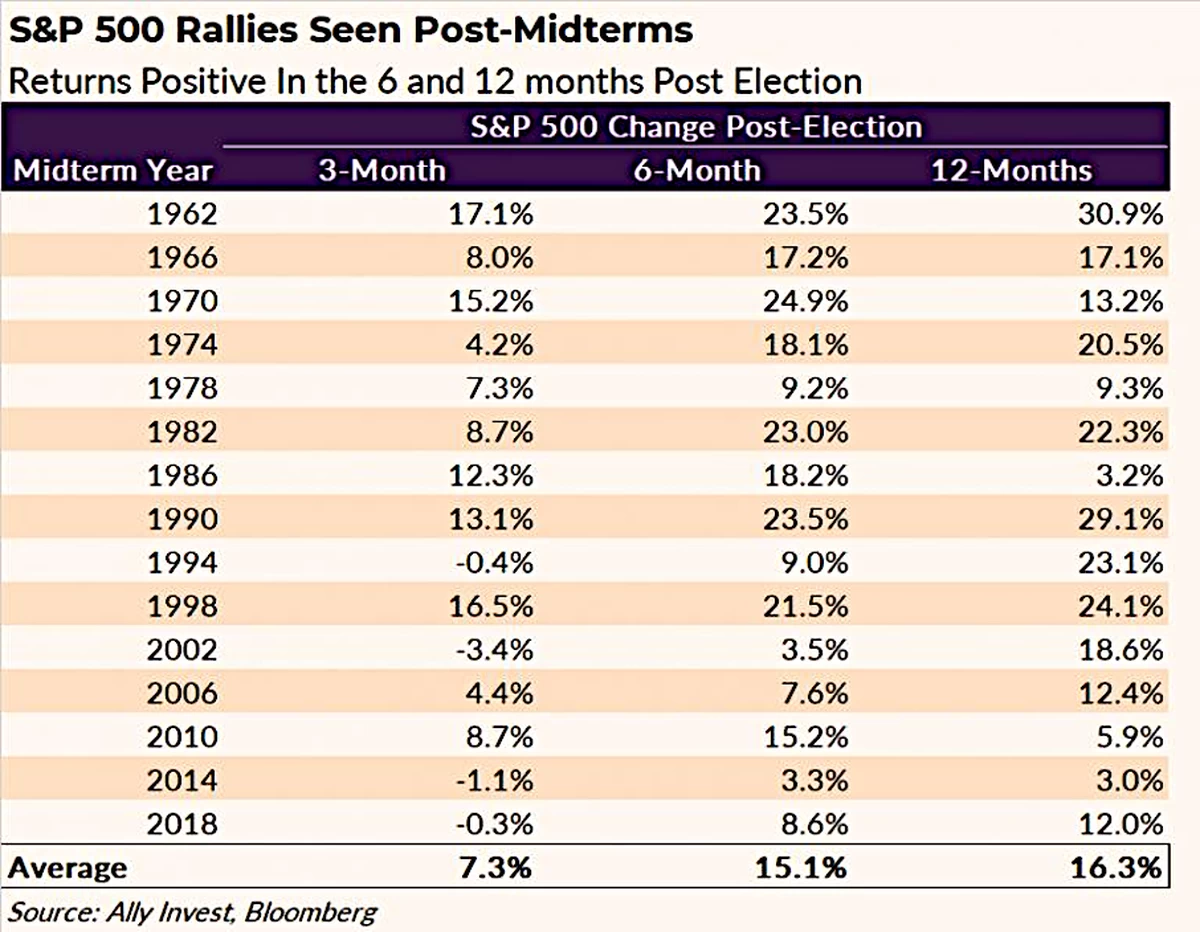
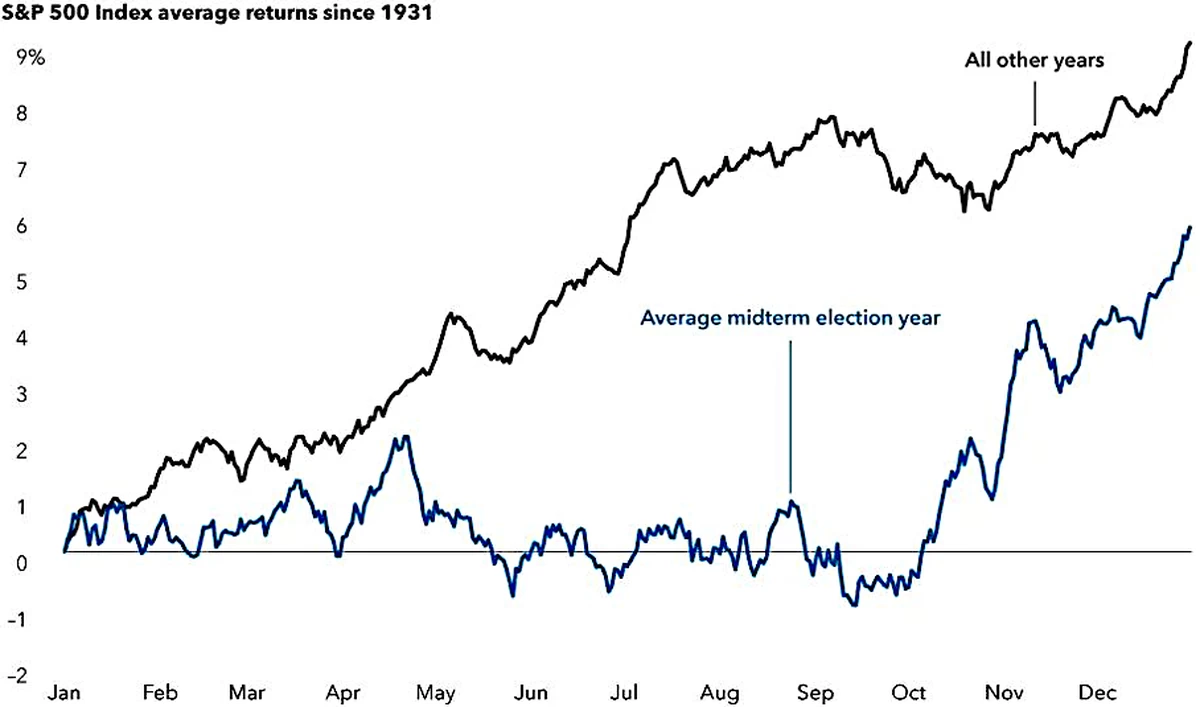
The S&P 500 has historically delivered positive returns following midterm elections, although the magnitude of each move has varied substantially. Source: Capital Group.
I also consider the comparison period carefully because equities tend to rise over multiple rolling 12-month periods, regardless of the election calendar. J.P. Morgan Asset Management found that the S&P 500's average total return in the fourth quarter of midterm years was 6.6%, following slightly negative average returns across the preceding three quarters. The same research suggests that markets often begin recovering before election day, making it difficult to attribute subsequent gains solely to the results.
The measurement window also matters because price returns exclude dividends, while total returns include reinvested dividends. I would therefore avoid comparing historical figures without checking their methodology, starting dates, and holding periods.
Does the winning party matter?I would not build a trading strategy around the assumption that either Republicans or Democrats consistently deliver better equity performance after midterm elections. Historical research suggests stocks have generally performed positively under different political configurations, while the relationship between party control and subsequent returns remains difficult to isolate from economic conditions.
Instead, I focus on how election outcomes could affect expectations for corporate taxation, government spending, regulation, and trade policy. These developments can influence individual sectors differently, even when the broader index shows limited reaction.
For example, companies exposed to government spending or regulatory changes may respond differently from technology, financial, or energy stocks. The overall market direction still depends heavily on earnings expectations, valuations, economic growth, and interest rates.
Can a divided government support equities?A divided government is often seen as supportive for equities because legislative gridlock can limit sweeping policy changes and reduce uncertainty around future regulation or taxation. However, I treat this as a potential market influence rather than a dependable bullish signal.
J.P. Morgan's historical analysis shows that returns have varied across government configurations and warns that these averages reveal relatively little about future performance. Monetary policy, corporate profits, labour-market conditions and economic growth remain more dependable drivers of equity returns.
That’s why I pay closer attention to whether the election changes fiscal policy expectations or introduces new risks around government funding, tariffs, and regulatory oversight. Political stability can support sentiment, but unresolved fiscal negotiations or policy disputes can create fresh volatility.
Why uncertainty may matter more than election resultsMy main takeaway from the historical evidence is that markets may respond more to uncertainty being removed than the winning party’s identity. Before election day, investors must assess several possible political outcomes and their implications for economic policy.
Once results become clearer, markets can adjust expectations and return their attention to earnings, inflation and monetary policy. This process can support equities when the outcome removes a significant risk or proves less disruptive than investors anticipated.
However, uncertainty does not disappear simply because voting ends. Disputed results, unexpected policy proposals or changes in fiscal expectations can extend political risk beyond election day.
What I watch as a trader
When assessing markets around the 2026 midterms, I will monitor several markets together rather than relying on historical seasonality alone.
● S&P 500: I use the broader index to assess overall equity sentiment and price action.
● Nasdaq and Dow Jones: I compare their performance to identify differences in technology exposure and broader sector participation.
● VIX: I monitor implied volatility to assess changing demand for equity protection around political developments.
● US Treasury yields and the dollar: I track their reactions to changes in fiscal expectations, inflation, and Federal Reserve policy.
● Sector performance: I examine whether election-related moves reflect broad market sentiment or specific policy expectations.
When I turn that cross-market analysis into a CFD trade, spreads become part of the decisions. While a tighter spread can reduce the initial cost, a stable spread can make the cost of my strategy more predictable. That’s where the broker becomes part of the analysis. Exness’ approach to pricing reflects the same principle: the spread is part of the setup, not an afterthought once a position is open.
The headline figure is only the starting point. Political repricing can produce sudden volatility and moves that look unusual on a chart. If a CFD trader wants to investigate a price, spread, or stop out, Exness’ public tick history lets anyone check recorded bid and ask prices down to the millisecond. For me, that visibility matters because I can assess what happened against the market conditions at the time rather than rely on how the move appears afterwards.
History provides context, not a forecast
The historical record supports the observation that US equities have often performed strongly during the year following midterm elections, but I wouldn’t treat that pattern as an automatic buying signal. A more useful approach would combine historical tendencies with current valuations, earnings expectations, monetary policy, and the market's reaction to political developments.
For me, the key question is not who wins the election, but whether the result changes the economic outlook enough to alter the direction of the market.